Machine Learning
Our objective in this analysis is to predict demand and sentiment to inform growth and marketing tactics. Specifically, we assessed Glossier demand in relation to external factors and competitors and user interactions as a determinant of sentiment. Through forecasting techniques, we determined that Glossier demand is expected to decrease through September 2022 (assuming present is August 2022). Interestingly, however, demand is expected to increase through September 2022 for one of our main competitors, Ulta. We will explore mechanisms to adopt Ulta strategies and conduct external research to understand why our market share is expected to decline while our competitor’s is set to skyrocket.
We were also able to deduce that Glossier demand has no relationship with COVID-19 case rates and will not leverage the pandemic as a proxy for gauging demand. We also determined that user interactions and activity on social media platforms are not a good indicator of measuring brand sentiment. Similarly, we determined that brand popularity, based on google search trends, is not a good indicator for sentiment at the given point in time for either Glossier or its competitors. Thus, we will allocate less user research resources to understand customer happiness on social media.
Analysis
The analysis conducted in this section is aimed at analyzing machine learning related questions only. As such, not all business goals have been addressed and some business questions may only be addressed in part.
Business Goal 4: At what point in the year will demand for Glossier be highest? How does this compare with competitors?
A SARIMA model was leveraged to model and predict the number of submissions and comments to the Glossier subreddit due to the inherent seasonality in the data. The number of submissions and comments to the Glossier subreddit is used as a proxy for demand. The data was differenced to induce stationarity and the optimal model was found to be SARIMA(1, 1, 1)x(0, 1, 1, 20), selected with the lowest AIC score of 6715.42. The forecasts of this model are depicted in figure 1. The same processes were used to model the Ulta subreddit submissions and comments in order to obtain a comparison with competitive data. The optimal model for the Ulta data was found to be SARIMA(1, 1, 1)x(0, 1, 1, 20) with the lowest AIC score of 5852.97. The forecasts of this model are also seen in figure 1. The top 10 models tested for each brand are shown in tables 1 and 2 and their AIC and BIC scores.
One can see from the figures that the Ulta subreddit post count has a more upward trend overtime than that of Glossier. The models successfully predict the next month of “demand” in a similar trend that it has seen in the training data, with Glossier continuing at a constant rate and with Ulta increasing slightly. From this data, we can conclude that there is more market interest in Ulta than in Glossier. Ulta, like Sephora, is more of a department store for makeup and skincare products, carrying many brands. From our analysis, Glossier should partner with Ulta or Sephora and sell Glossier products in their stores. This is sure to increase awareness of their products and increase their market share. An interesting observation on the Glossier data is that there appears to be clear spikes in subreddit activity just before the holidays. Given that we only have one year of data, the model does not pick up on this pattern. If we had more than one year of data, perhaps the model could more accurately predict annual trends and could thus more accurately predict trends farther out than one month.
Figure 1
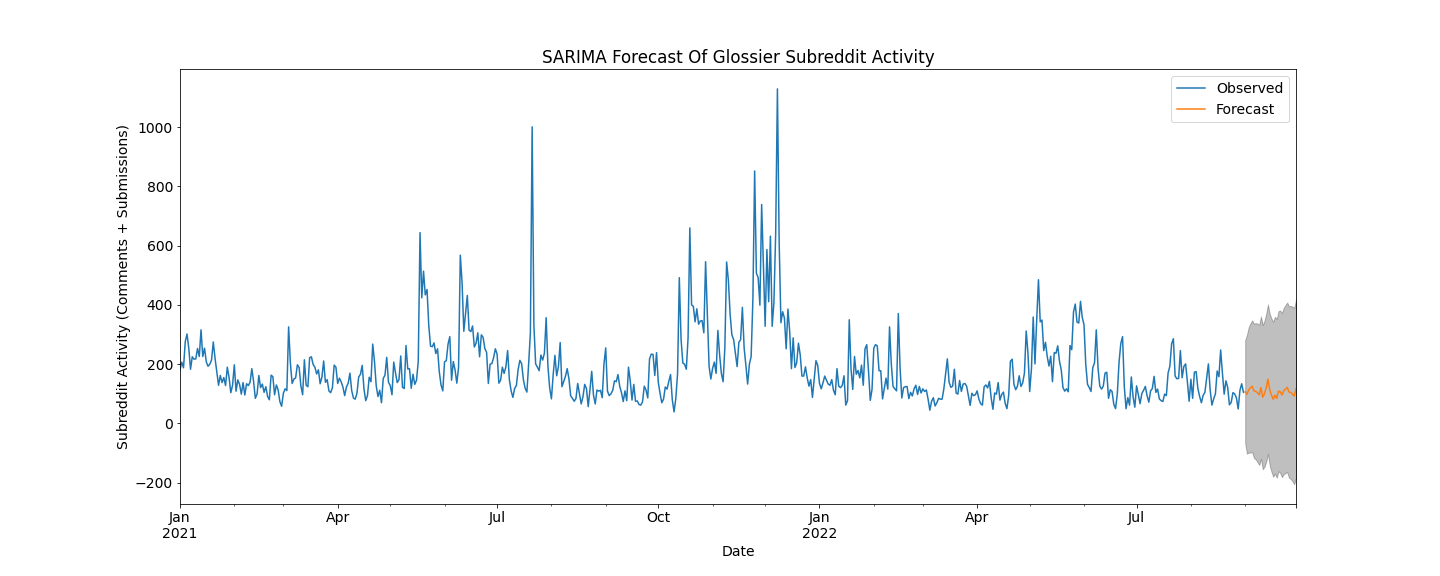
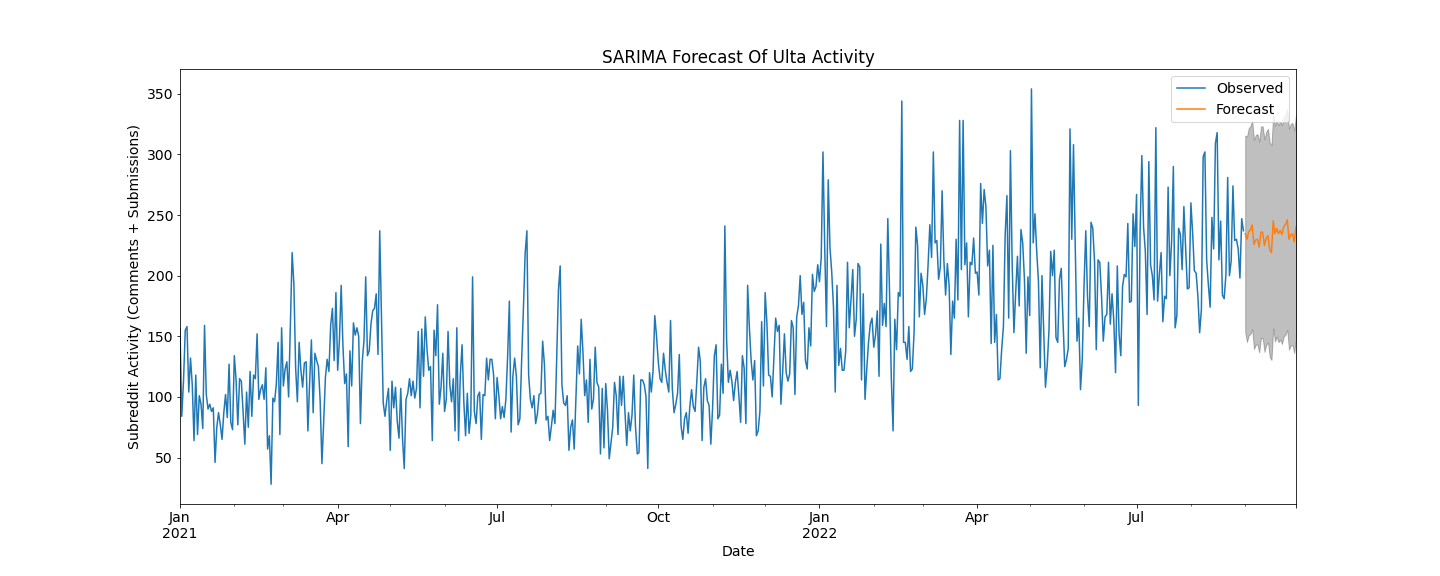
Table 1: Glossier SARIMA Scores
Table 2: Ulta SARIMA Scores
Business Goal 5: How has demand for Glossier been affected by COVID-19 rates? Can we get an understanding of what the relationship between the two may look like for the future?
A vector autoregression model was utilized to assess the relationship between COVID-19 rates and Glossier subreddit submissions and comments as a proxy for Glossier demand. The model took into account total activity count in the Glossier subreddit, daily new cases of COVID-19, and daily new deaths of COVID-19. The optimal model included a maximum lag value of 13 which was selected utilizing the lowest BIC score (48.02) along with a comparably low AIC score (47.10). As seen in figure 2, the model was able to quite accurately predict the test set in that the predictions are close to the real values and follow the same pattern of fluctuations. Granger’s causality test was also performed on the data to determine whether any of the time series variables can be used to forecast another, the results of which can be seen in table 3. It’s clear from the results of Granger’s causality test that none of these time series can be used to predict another. Thus, we can conclude that Glossier subreddit submissions and comments were not affected by COVID-19 new cases or deaths from January 2021 to August 2022.
Figure 2
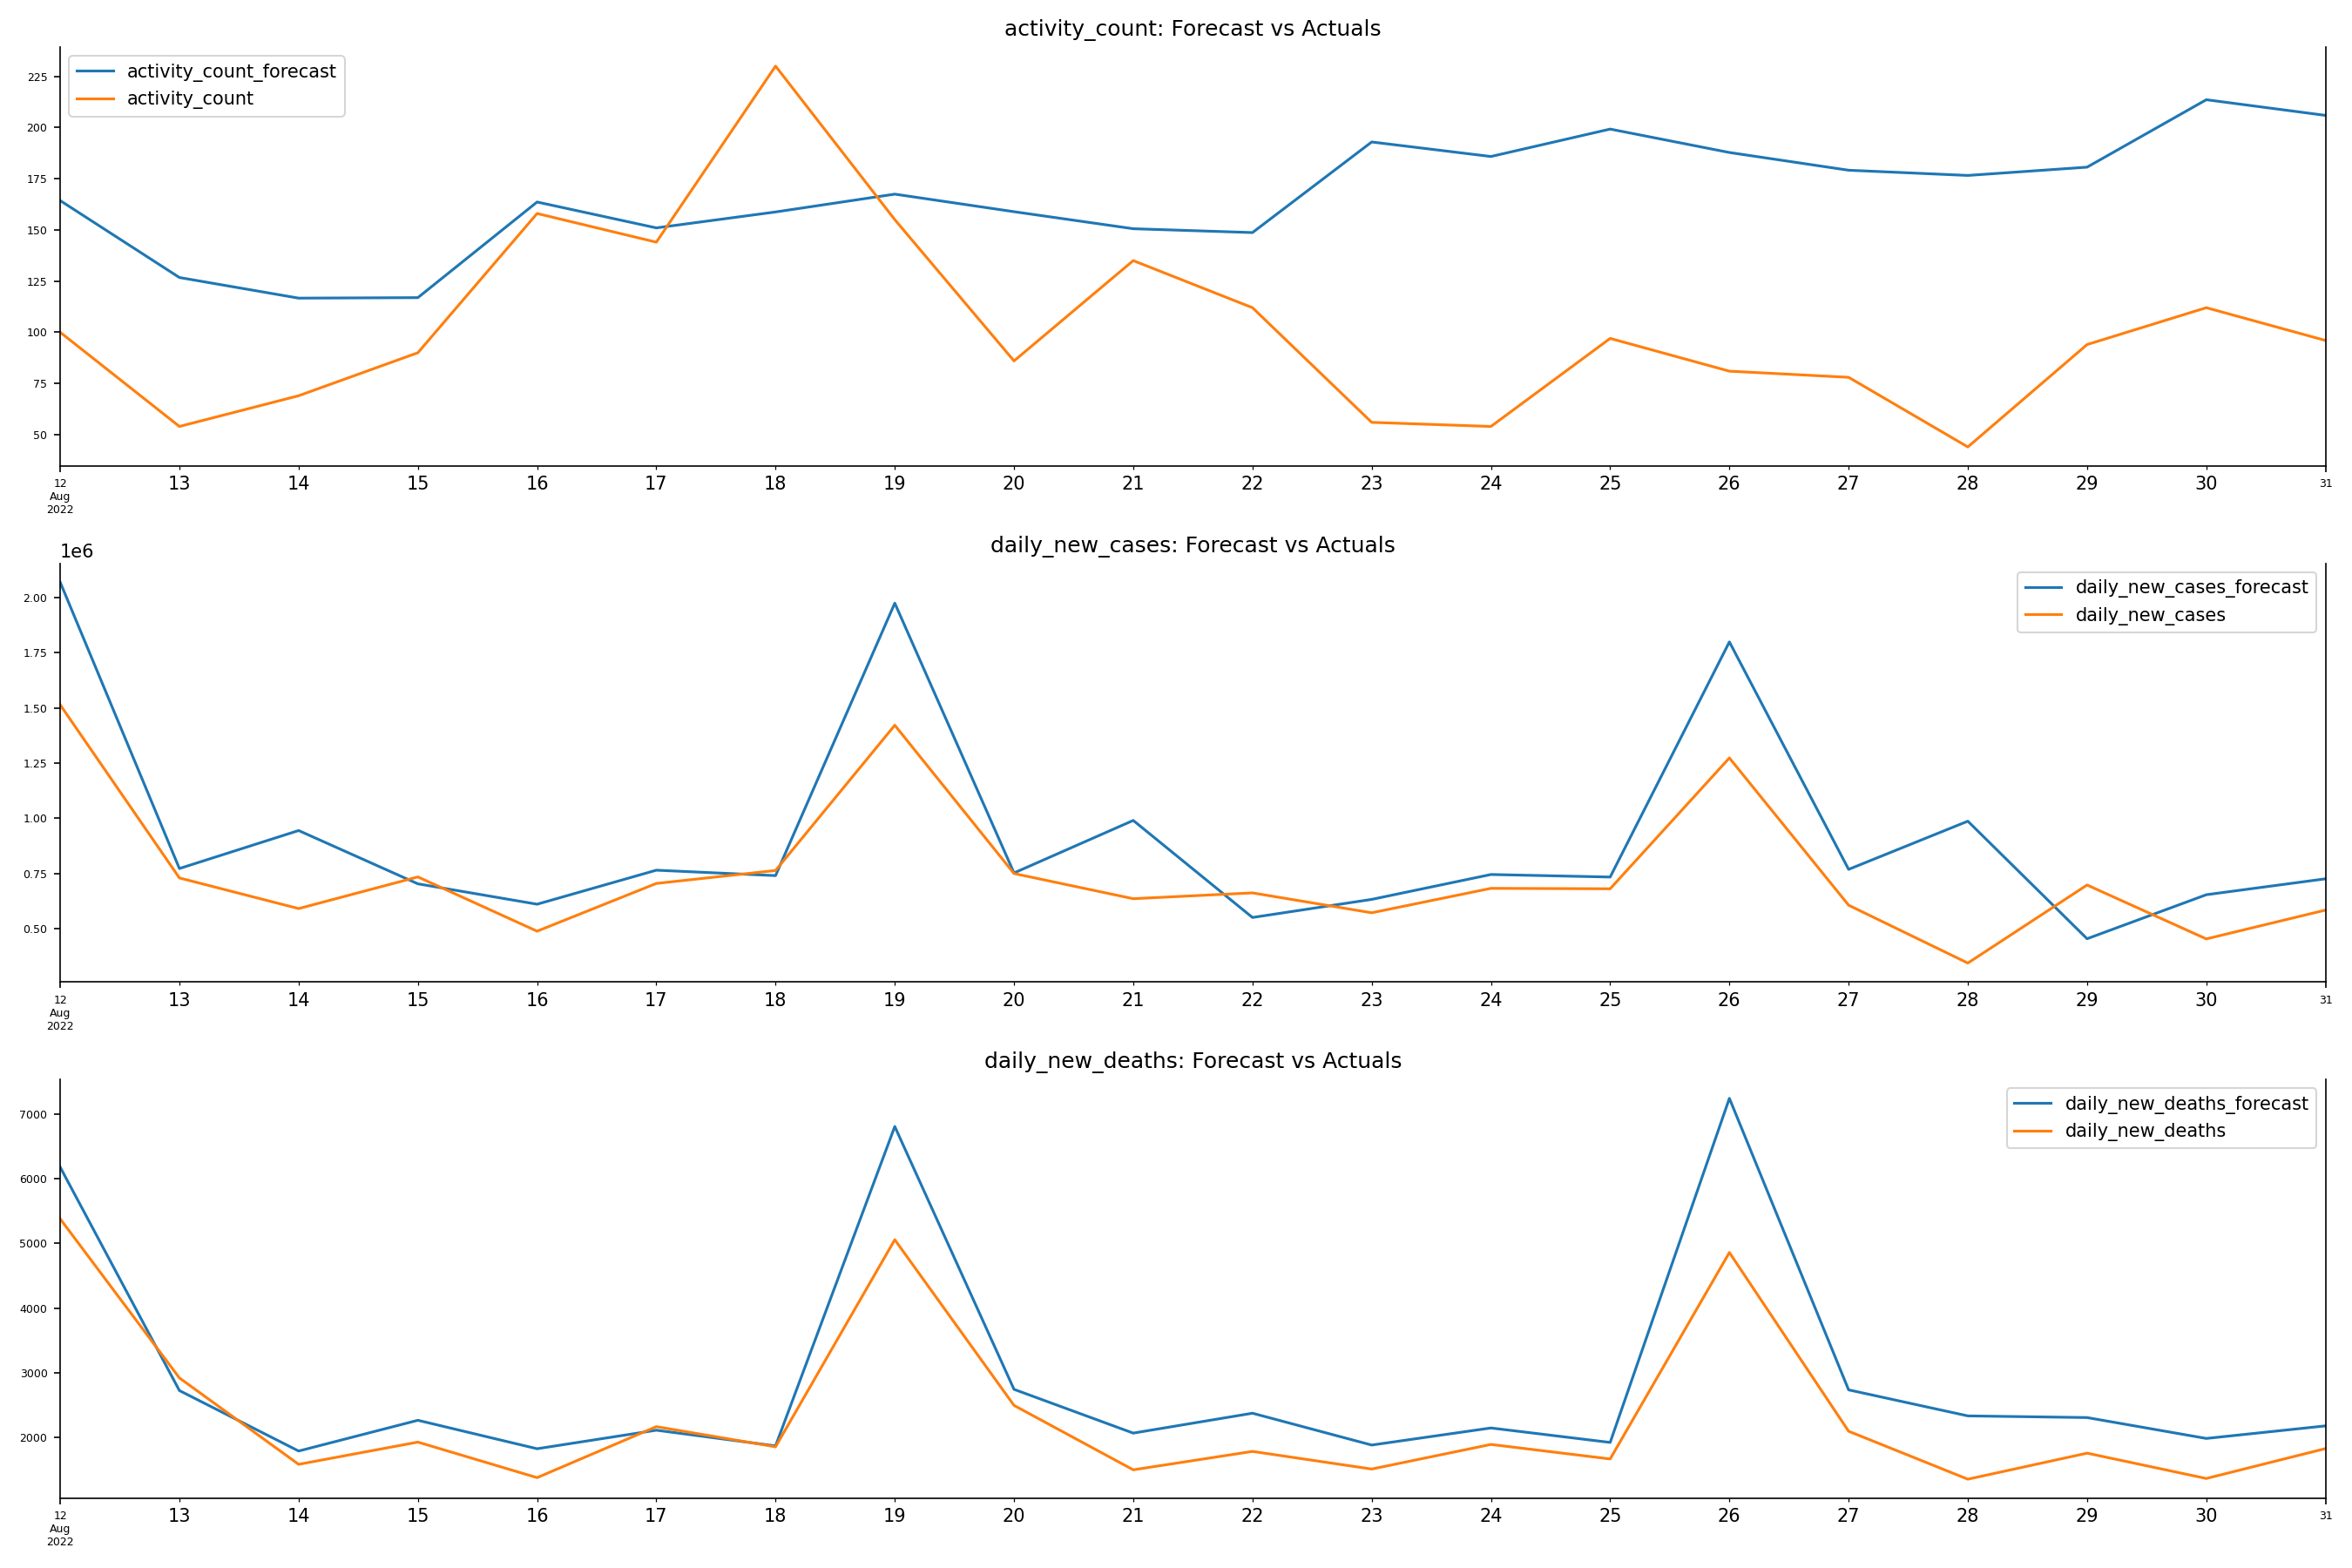
Table 3: Granger Causality Test Results
Business Goal 7: Are user interactions on Reddit predictive of their overall sentiment towards the brand?
To determine whether or not user interactions - specifically the number of upvotes on posts, whether a post was edited, whether a post was stickied, and the total glossier-related activity on reddit - can accurately predict user sentiment, four classification models were developed. A logistic regression model and decision tree model were built in addition to two separate random forest models, each utilized hyperparameter tuning. From table 4, it is evident that both random forest models and the decision tree model yielded the highest accuracy of 60%. One can conclude from this result that it is difficult to predict user sentiment based on these four independent variables. This may have resulted from the way overall sentiment was attributed to a user, by assigning the rounding the average sentiment score to its categorical equivalent. Although not displayed, the random forest models also achieved a weighted precision value of ~.41, the decision tree model achieved a weighted precision value of ~0.57, and logistic regression of ~0.48. Weighted precision values indicate the weighted mean of precision with weights equal to class probability. Figure 3 provides more granular information as to where each model predicted the sentiment correctly and where it failed via confusion matrices. Because none of these models achieved over 80% accuracy, Glossier can surmise that user interactions on Reddit are not a good indicator of their sentiment towards the brand.
Figure 3
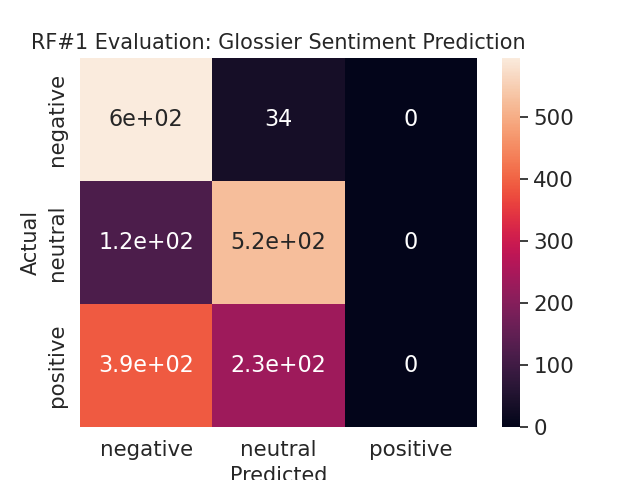
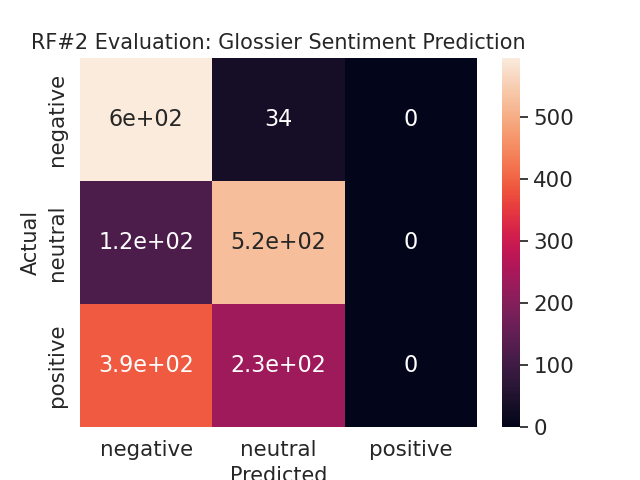
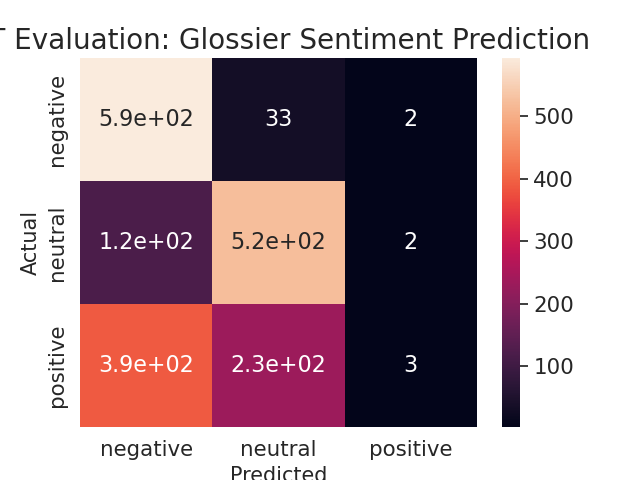
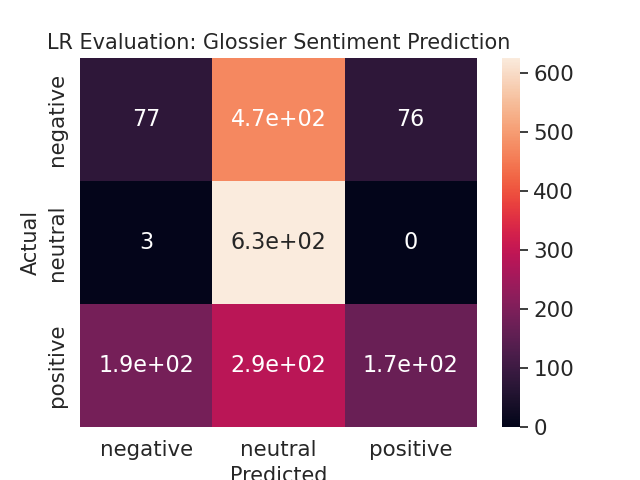
Table 4: Classification Model Comparison
Business Goal 8: Can user interactions predict the exact sentiment of a user towards Glossier and how can this inform rollout strategy?
Because sentiment category prediction with user interaction information did not yield high accuracy, we leveraged regression techniques to accomplish the same goal as above, but this time predicting the average user sentiment score. A linear regression model and two separate random forest regression models, each with different parameter sets were leveraged. From table 2, it is evident that all three models yielded very similar RMSE values of approximately 0.70. Although not displayed, each model also attained a poor R2 value of 0. Figure 4 provides more granular information as to where each model predicted the sentiment score correctly and where it failed. Similar to above, all the models consistently predicted average sentiment scores of approximately ~1.5 for every user. The models’ poor performance could be attributed to the way overall sentiment was calculated by user - assigning numerical values of 0, 1, and 2 to negative, neutral, and positive values respectively and then getting the average score for each user. With the current sentiment derivation, Glossier can conclude that user interactions on Reddit are not indicative of customer satisfaction towards the brand.
Figure 4
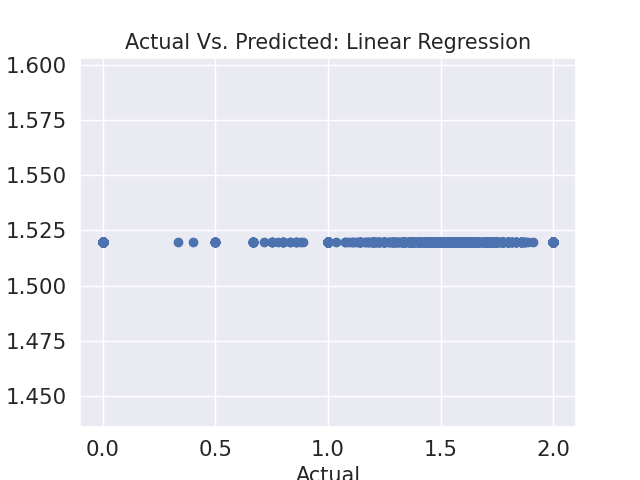
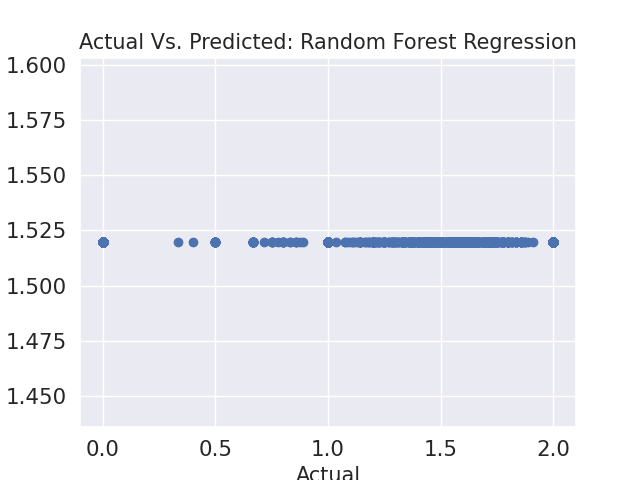
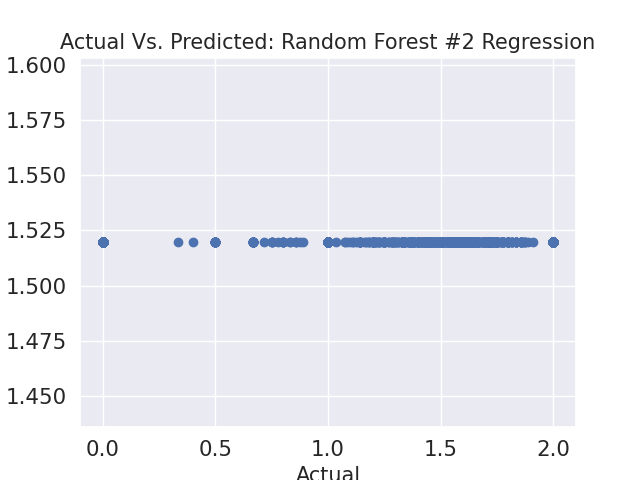
Table 5: Regression Model Comparison
Business Goal 9: Are Google trend searches predictive of daily user sentiment?
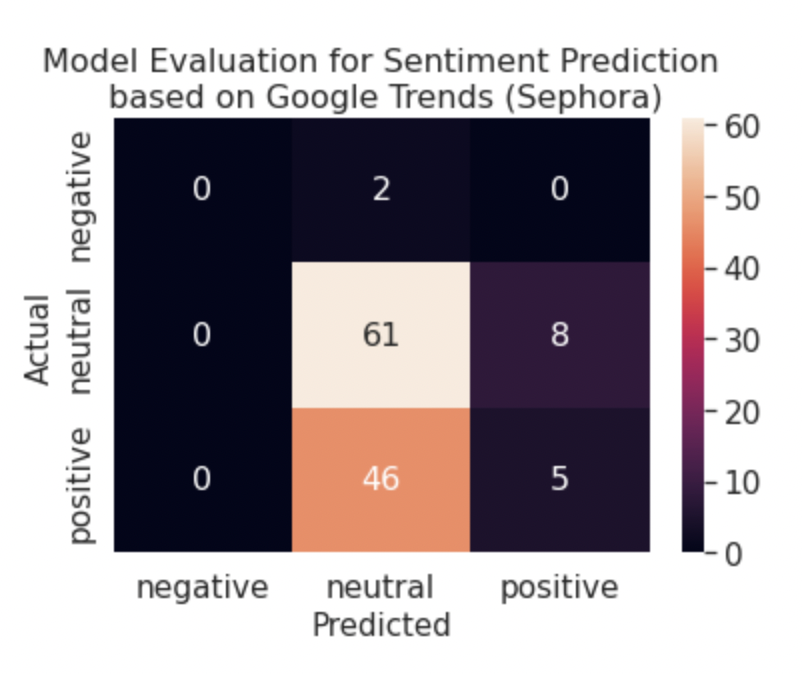
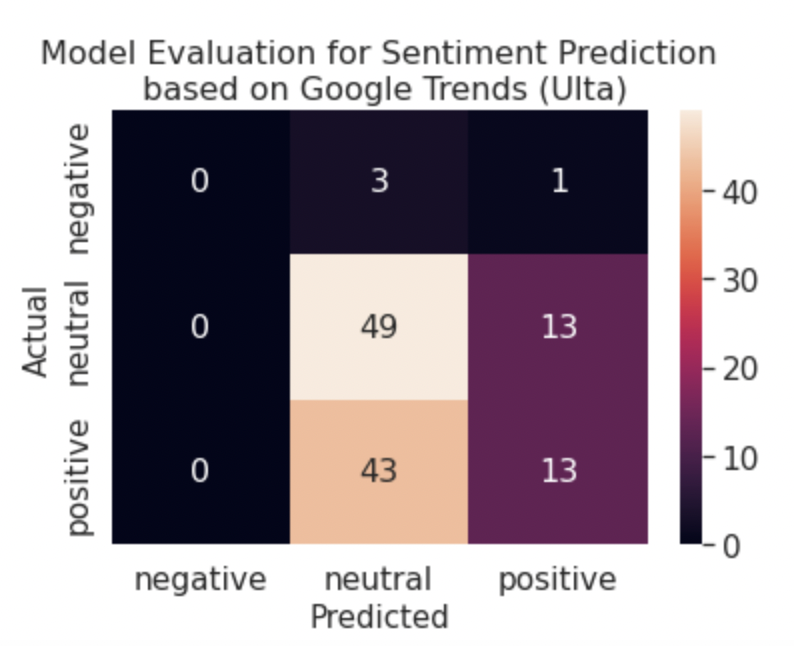
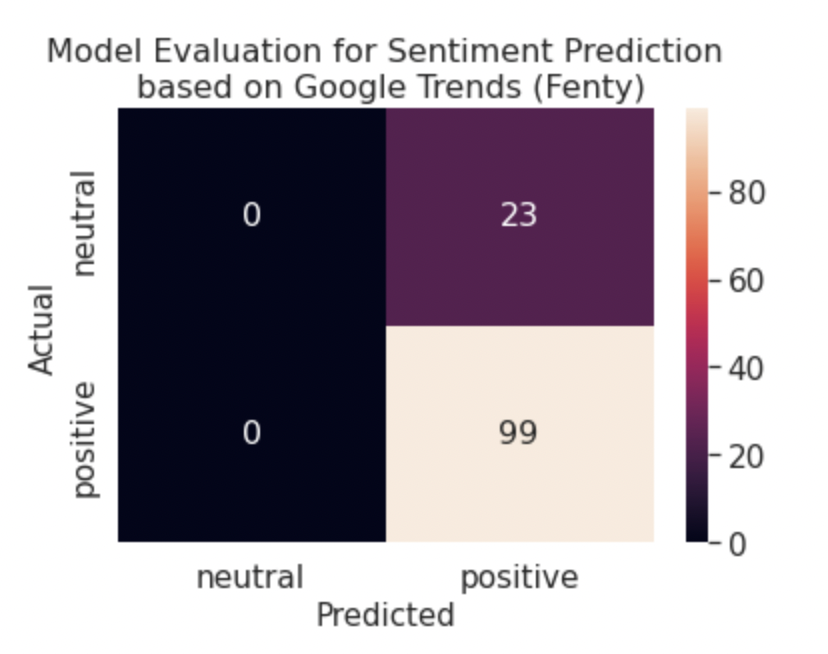
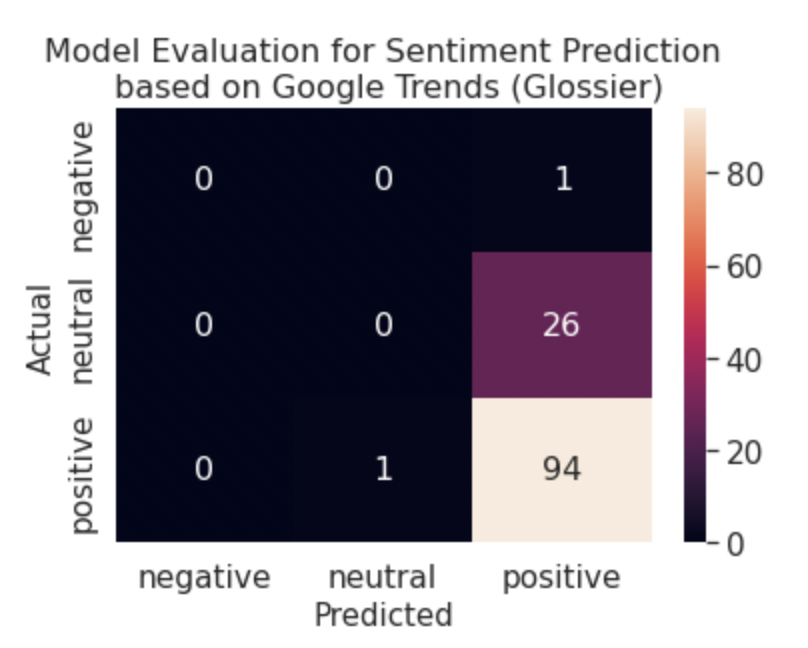
Our original technical proposal focused on determining a correlation between daily user sentiment and google trend searches (as a proxy for popularity) via linear regression. However, after running linear regression, we attained extremely poor results, including an R^2 value of 0.04 and an RMSE value of 0.36. As a result, we shifted our focus to determine if google trend searches were predictive of daily user sentiment via classification techniques. To accomplish this, we built a random forest model that was applied on four separate brand datasets (Sephora, Ulta, Fenty and Glossier). These random forest models yielded significantly better results as can be seen below.
From the tables 6, 7, 8, and 9, we can tell that random forest was far more accurate for the Glossier and Fenty data than the Ulta and Sephora data. We expanded this analysis by developing confusion matrices to compare the prediction results of the random forest model. From figure 5, it is apparent that the random forest model is best at predicting positive sentiment values. We believe this is due in part to the fact that data is imbalanced, meaning that there are far more positive values than other ones. Furthermore, this imbalance explained why the random forest model only predicted neutral and positive values for Fenty since there are no negative values in the data set to begin with. Since these models achieved over 80% accuracy for Fenty only, we conclude that google search trends and brand popularity is not a strong predictor for daily user sentiment.
Figure 5
