Introduction
Online hate speech has unfortunately become increasingly prevalent specifically on social media platforms. Twitter can be used as a tool to spread misinformation and hate with the protection of anonymity behind a screen. Recently, online hate speech has even been known to incite violence. Consequently, this has contributed to the rising awareness of the spread of online hate speech and has inspired a movement to hold these social media platforms accountable for the real world consequences of the content they are pushing to users. Studies have found that hate speech on Twitter can predict the frequency of hate crimes [1]. The debate over whether or not free speech in the 1st Amendment should be protected over hate speech online has become a heavily divided topic. Social media platforms should take a stand against the spread of hate. The following analysis explores research conducted to build a model that will be able to detect tweets from Twitter that contain these “hate speech” sentiments.
Dataset
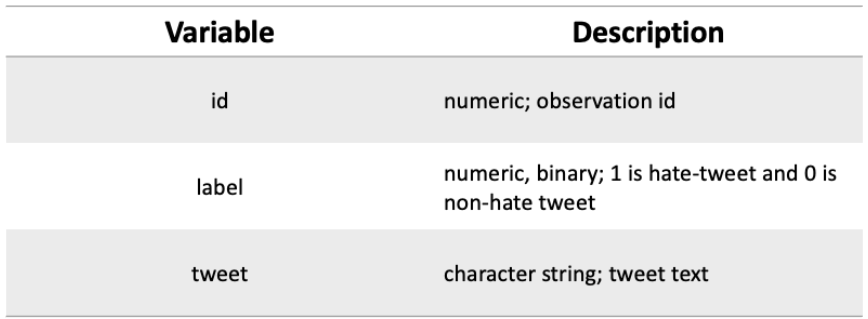
The analysis was conducted on a labeled dataset obtained from Kaggle, Twitter Sentiment Analysis. Hate speech here is defined as racist and/or sexist sentiments. The train dataset contains 31,962 observations of 3 variables.
Preprocessing
Data preprocessing involved three key steps; data cleaning with manual methods and a spaCy text-preprocessing pipeline, building a bag-of-words document term matrix, and some initial exploratory data analysis. Because the Kaggle Twitter train dataset is so large, this analysis focuses on a two thousand tweet subset due to processing power constraints.
The data was cleaned by removing extraneous characters and numbers, stopwords (words that are very commonly used like “the” and “is”), and any misspelled or slang words (for example “idk”). The tweets were run through a spaCy pipeline ‘en_core_web_sm’. The pipeline includes tokenization, part of speech tagging, and lemmatization capabilities.
Bag of words (BOW) techniques using CountVectorizer were then implemented to extract the words from the tweets and evaluate word frequencies. The data was then split into training and testing sets, the testing set being 20% of the original. Next, several modeling approaches were tested on the Twitter dataset including random forest, support vector machines, logistic regression, naive bayes, and BERT. The CountVectorized data was normalized using MinMaxScaler from scikit-learn for the support vector machine models. Each mode is evaluated below on their accuracy rates of predicting that a tweet is “hate speech” or “non-hate speech”.
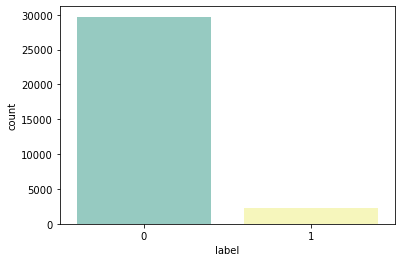
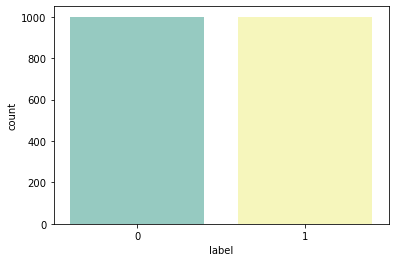
The figures below depict label frequency in the larger dataset and the subset. One can clearly see that the label distribution is very uneven in the full dataset in that there are much fewer hate-speech tweets (1) than non-hate speech tweets (0). Hate-speech tweets make up about 7% of the total observations. It is important that the dataset used to train the predictive models in this analysis is balanced, meaning that it has an even number of observations with each label. To control for this, the tweets from the full dataset were separated by label and a random sample of 1,000 tweets was taken from each and then combined, ensuring that the training dataset for the models is balanced.
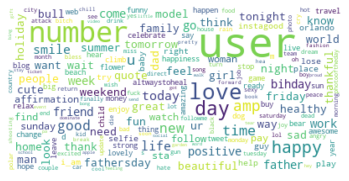
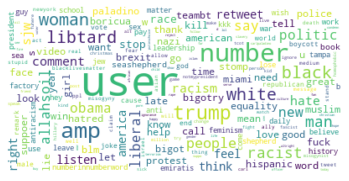
The word clouds below illustrate the most frequently used words in non-hate speech tweets and hate speech tweets. It is clear that the wording used in hate speech tweets is much more negative than that in non-hate speech tweets.
Analysis
Random ForestRandom Forest is a supervised machine learning algorithm that is used for classification by building numerous decision trees on different samples. The data is then classified by the random forest algorithm using the return value output by the most trees. This model was tuned using GridSearchCV from scikit-learn. The optimal values for the classifier are 200 decision trees, none as the maximum depth of the tree, 2 as the minimum number of samples required to split an internal node, and 2 as the minimum number of samples required to be at a leaf node.
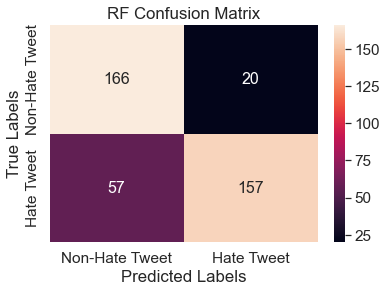
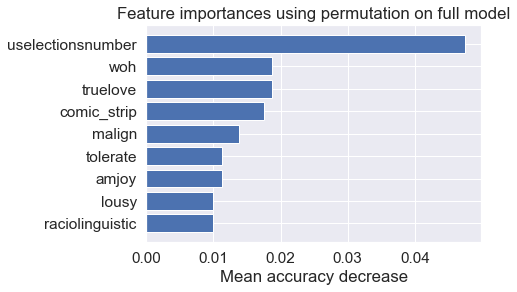
The resulting confusion matrix and feature importance visualization is below. The accuracy of the random forest classifier is 0.81 and the F1 score is 0.78. From the confusion matrix, one can see that more tweets were incorrectly classified as non-hate than incorrectly classified as hate.
Logistic Regression
Logistic regression is a supervised learning classification algorithm used to predict the probability of a target variable which is, in this case, hate speech. This model was built with 1,000 maximum iterations.
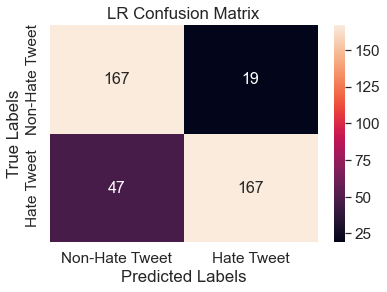
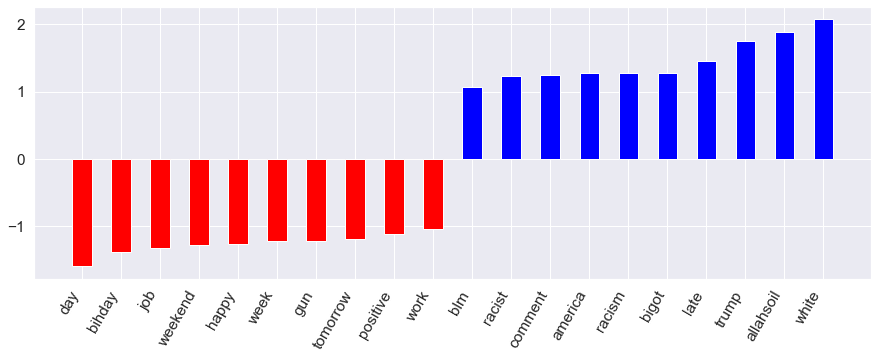
The resulting confusion matrix and feature importance can be seen below. The accuracy score indicates that 83% of the tweets were accurately placed into either hate speech or non-hate speech categories. This model also achieves an F1 score of 0.84. These metrics are both slightly higher than the random forest classifier. The feature importance visual below shows the features with the largest in absolute value positive and negative coefficients. In other words, the blue bars represent the top words associated with hate-speech and the red bars represent the top words associated with non-hate speech. Key words such as racist, bigot, and white are positively associated with hate tweets. Meanwhile, happy, positive, and weekend are negatively associated with hate-speech tweets and are seen as important words within non-hate speech tweets.
Multinomial Naive Bayes
Naive Bayes is a supervised machine learning technique that utilizes conditional probabilities and Bayes Rule. It makes the assumption that features are all independent of each other, hence the name “naive.” In this instance, the model is used to predict which tweets are categorized as hate or non-hate speech. The process works by calculating the probability of a word occurring at different frequencies within a tweet, taking into account the labels. The model then predicts the category of the tweet based on the frequency of conflicting words contained in the tweets.
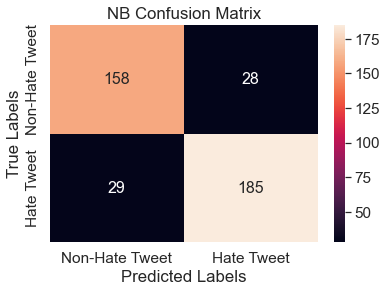
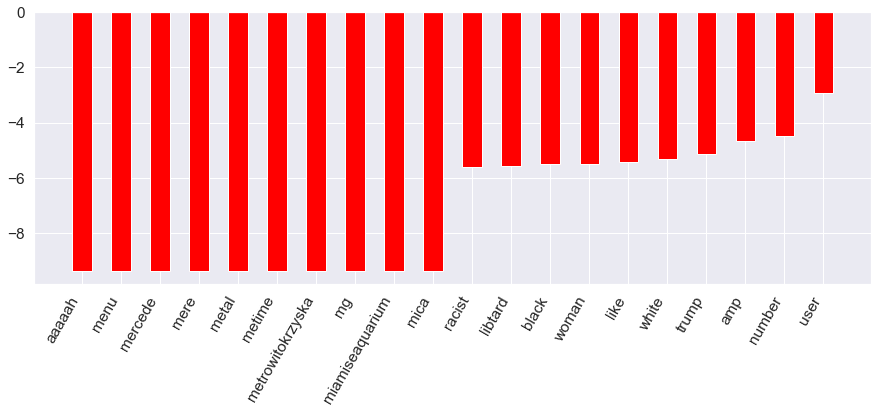
The resulting confusion matrix and feature importance can be seen below. This model achieves an accuracy score of 0.86, which is a relatively high score, and an F1 score of 0.87. 86% of the words here regarding hate or non-hate speech were correctly classified. From the confusion matrix below, one can see that the model mis-classifies hate speech and non-hate speech with similar frequencies. This model also produces many more negative correlations among the features with hate speech than other models, depicted as the red bars in the feature importance bar chart. Similar to logistic regression, words associated with racism are significant predictors of hate speech.
Linear SVM
A Support Vector Machine (SVM) is a machine learning algorithm that analyzes data for classification analysis by splitting it into two categories where the separator has the largest margin between the two groups. A linear kernel was used here, meaning a linear separator between the classes. The cost parameter used in SVM models can be defined as the cost of misclassification and is a regularization parameter. For this linear model, the cost is set to 1.
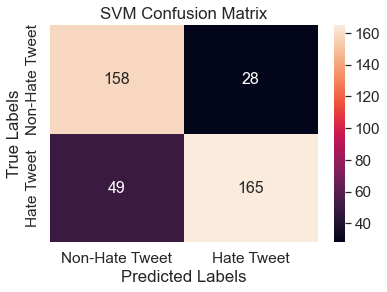
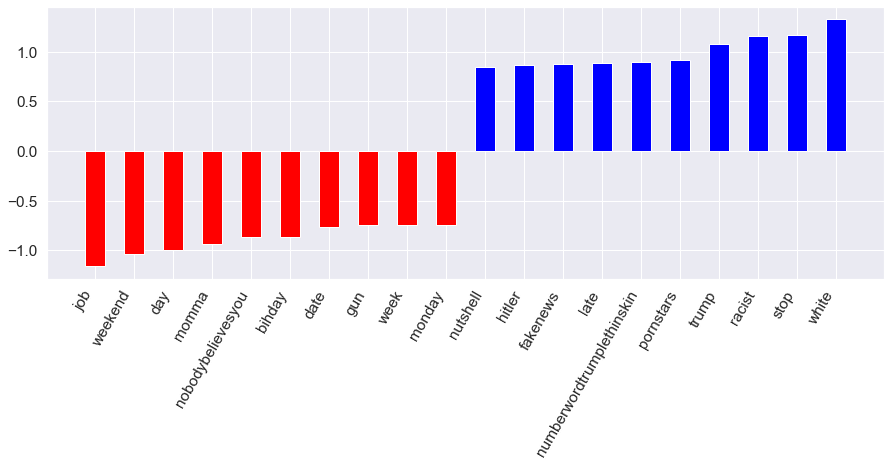
The resulting confusion matrix and feature importance charts can be found below. The Linear SVM had an 81% accuracy when predicting the words into either hate or non-hate speech categories and an F1 score of 0.81 as well. Similar to the random forest and logistic regression models, from the confusion matrix, one can see that the model mis-classifies more observations as non-hate than hate.
RBF SVM
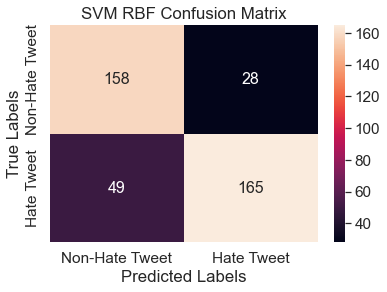
An additional SVM model with a non-linear RBF kernel was implemented to test if a better performance could be achieved. Here, the cost parameter was set to 10. The resulting confusion matrix can be seen below. The accuracy and F1 score of the RBF SVM was equal to that of the Linear SVM, 0.81.
Bidirectional Encoder Representations for Transformers (BERT) is a language representation tool with many applications in natural language processing. It is a deep learning method used to help machines understand the meaning of vocabulary in text by using surrounding words to establish context. A BERT model relies on the attention layer in a neural network to learn these contextual relationships between words.
Here, DistilBERT is used which is smaller, and more general-purpose than a BERT model. It was run on the same subset of 2,000 tweets for consistency. Through trial and error, 4 epochs were found to attain the highest accuracy and F1 scores of 0.80.
Conclusion

Given the increasing prevalence of online hate-speech, it is vital that social media platforms such as Twitter have methods to detect it on their platforms and hopefully diminish its negative effects. This analysis has explored different predictive modeling approaches to detect hate-speech on Twitter. From the comparative table above, it is clear that the multinomial naive bayes model achieves the highest accuracy score of 0.86 and the highest F1 score of 0.87.
Reflecting on the process of this research, there are two main areas that could be improved in further analysis on this topic. Primarily, processing power constraints significantly limited how much training could be done on these models. Because training is a critical step in building an accurate model, more processing power would increase the amount of data used to train and would considerably enhance and refine the results. Another limitation in this research was the lack of hate-speech tweets in the labeled dataset obtained from Kaggle. In order to mitigate this, the full dataset was separated by label (hate-speech and non-hate speech) and a random sample of 1,000 observations was taken from each and combined into the dataset used for analysis. Because the 1,000 hate speech tweets were taken from a much smaller pool, this could have introduced some bias. A more balanced initial dataset would alleviate this risk of bias.
Interestingly, the majority of the models implemented on the data incorrectly classified more hate speech as non-hate speech than the opposite. It seems that the most likely explanation for this would be that non-hate speech contains more general language that could also be included in hate speech, where hate speech contains more unique and niche words that would not be found in other contexts. This could also be an impact of the sample bias of pulling hate speech tweets from a much smaller pool.
Given the challenges faced, this research has succeeded in building predictive models of hate speech on Twitter with accuracy nearing 90%. A precise model like this will allow Twitter to identify tweets containing hate speech and to strive to lessen the detrimental effects of hate speech on its users in the future.
Works Cited
1. Communications, N. Y. U. W. (2019, June 24). Hate speech on Twitter predicts frequency of real-life hate crimes. NYU. Retrieved January 16, 2023, from https://www.nyu.edu/about/news-publications/news/2019/june/hate-speech-on-twitter-predicts-frequency-of-real-life-hate-crim.html.