Introduction
Horse racing is one of the oldest sports, where spectators watch highly trained horses race across large fields and put money down on a horse of their choice. This betting is a core element of the sport and, if their horse wins the race, they receive a portion of all the money bet in the race. Given the monetary incentives, sports betting is highly studied as excited gamblers try to figure out how to select a winning horse. Thus, the goal of this analysis is to determine what factors contribute to a horse winning or not and assess if it is possible to predict if a horse will win. This research is in direct response to the Big Data Derby 2022 Kaggle competition that intends to help owners, trainers, and veterinarians improve equine welfare and assess competition strategy. Specifically, we hone in on competition strategy and explore if horse finish position, horse odds, and race purse can be predicted and what factors are most influential. We also assess if neural networks or traditional machine learning models are more effective.
The core data source of this project is the Big Data Derby 2022 Kaggle competition. It contains detailed information about horses and jockeys, results and monetary prizes, as well as the geographic coordinates of the horse in a race. This data was supplemented with text data of comments on each participating horse’s performance during each race. This was obtained by scraping the race history statistics pdf files from EQUIBASE. External weather data was also added to examine the impact of various weather conditions on horse performance. Using the Visual Crossing Global Weather API, historical weather data like precipitation, temperature, humidity, cloudcover, and snow for each race location/timestamp was collected.
Approach & Methods
Both traditional machine learning (ML) and neural network (NN) techniques were employed for each business question and results were compared. To prepare the data for modeling, standard preprocessing was used - including standardizing all numeric columns and label encoding all categorical variables. The text column was tokenized and TF-IDF vectorization was conducted. Traditional supervised learning models were first built to predict the outcome variable. This process has two merits. First, their performance was treated as benchmarks to further exploit the advantage of the NN framework and to build a NN model that outperforms them. Second, feature importance was extracted to gain insights into the dataset and aid with the NN model training process. Hyperparameter tuning was also performed to attain optimal models.
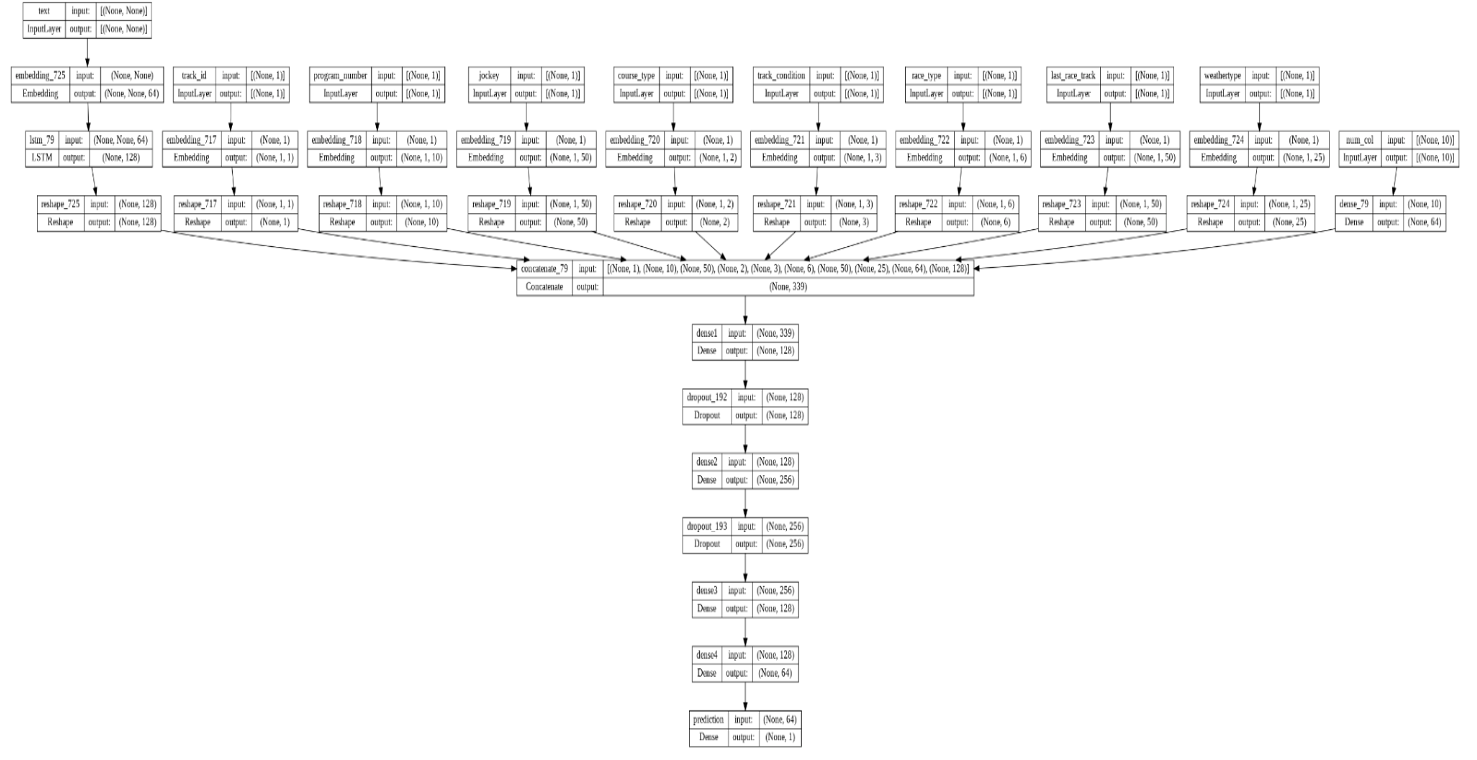
An ANN model that processed numerical, categorical, and text data was built to predict the target variables using the Keras functional API. Different input layers were specified for different data types. The structure is illustrated in figure 1 below. Embedding was performed for all categorical features; the dimensions were specified via the rule of thumb of taking the minimum number of fifty and the number of categories divided by two. Then, the embeddings for all categorical features were concatenated. The text sequences for each observation were tokenized, padded, and fed to the input layer. After that, we created embeddings for the text data input and processed them by RNN layers, such as the LSTM. Numerical variables were fed to a dense layer. A concatenation layer was created to combine all outputs from above. More dense layers were built to provide more non-linearity to the model.
Figure 1
Analysis & Results
Business Question 1: Can we accurately classify the winning and losing horses, and identify the factors that are most influential in determining this?
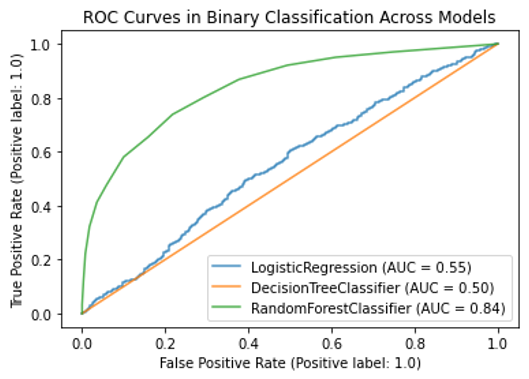
We hypothesized that race, jockey, and weather data would largely impact win predictions. Win was defined as placing in the top three finishers while lose constituted all other finishing positions. To validate the hypothesis, three separate binary classification models were built - Logistic Regression, Decision Tree, and Random Forest. Manual hyperparameter tuning was conducted for the first two models and automated tuning was performed for Random Forest to optimize the number of trees. The performance of these models is depicted in Figure 2 below. Logistic Regression and Random Forest performed significantly better than Decision Tree, yielding prediction accuracies of 81% and 79% respectively. Because Random Forest performed significantly better than Logistic Regression via ROC in Figure 3, it was selected as the most optimal ML model for win prediction and assessed against a NN counterpart. Figure 3 depicts this, where Random Forest has an AUC of 0.84 while Logistic Regression has an AUC of only 0.55.
Figure 2
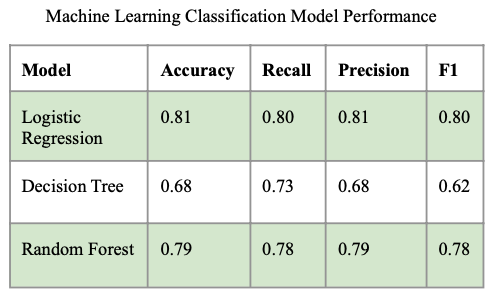
Figure 3
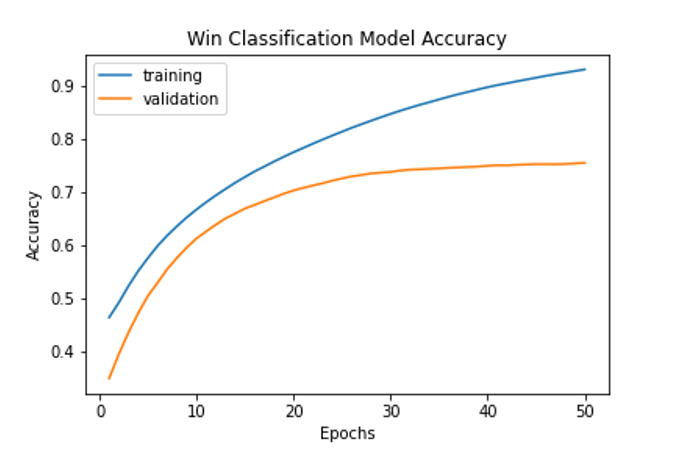
A neural network model was then utilized to predict the winner of a horse race in comparison to the initial model. Hyperparameter tuning was leveraged to optimize performance and the final neural network model consisted of 1 LSTM layer, 4 dense layers with relu activation, dropout with a value of 0.2, L2 regularization with a value of 0.00001, and Adam optimization with a learning rate of 0.01. As this is a classification model, it employed a binary cross entropy loss function. Initially, when run on all variables, this model was found to obtain an accuracy rate of 100% within one epoch. The model was learning to predict the race number plus date and horse number to predict the winners of a race. To correct this information leakage, race number and date were dropped from the training data so that the model would only use race and weather characteristics in its predictions. This model worked very well on the data and was able to predict “win” with an accuracy of 80%. The training and validation accuracy of the model across 50 epochs is displayed in Figure 4.
Figure 4
Comparison of ML results to NN results illustrates that both are excellent at classifying winner status, with ~80% classification accuracy. Through feature importance extraction, depicted in Figure 5, the jockey, horse, weight carried by the horse, and number of days since a horse last raced were most important in prediction.
Figure 5

Business Question 2: Can we accurately predict the race odds and what factors are most influential in determining this?
Exploratory research was conducted to determine how odds varied across race and weather-related variables. There appeared to be variance in the odds distribution across course type and track type values. As such, we hypothesized that these two variables would be important in predicting odds. To validate the hypothesis, three separate regression models were developed - Decision Tree, XGBoost, and Gradient Boost. Grid search was leveraged on the ensemble methods to automatically tune hyperparameters, while manual hyperparameter tuning was leveraged for the Decision Tree model. The performance of these models is depicted in Figure 6 below. Gradient Boost and XGBoost performed significantly better than Decision Tree. Because XGBoost had the highest R2 value of 0.328 and the lowest MSE value of 0.821, it was selected as the most optimal ML model for odds prediction and was assessed against a neural network counterpart.
Figure 6
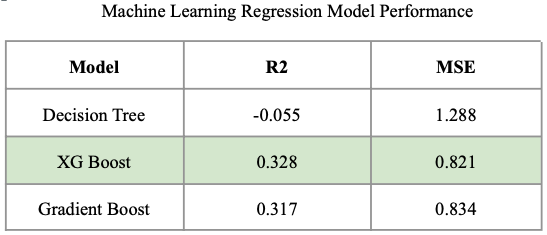
Figure 7
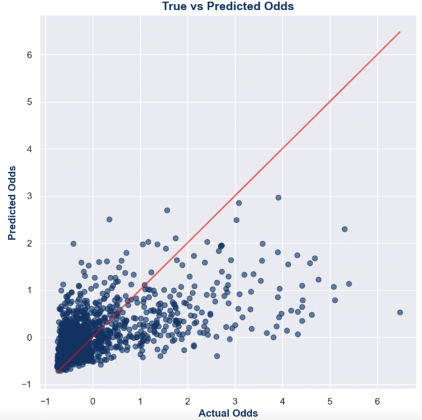
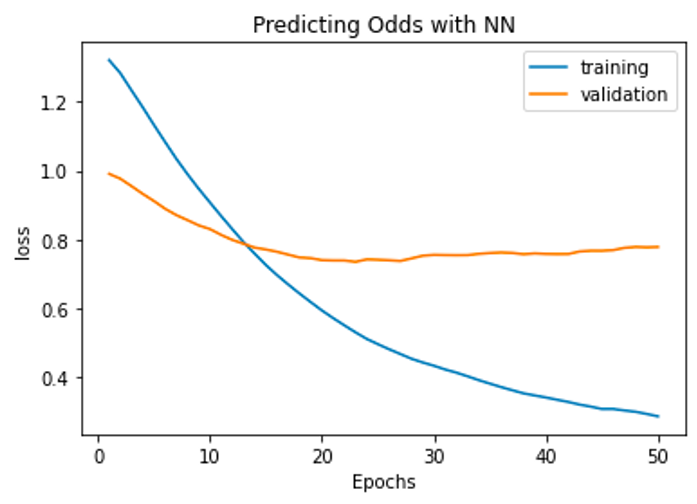
A NN model was utilized to predict the odds of a horse race in comparison with the traditional ML model. It was found that the same structure utilized for the first business question performed best for this model, with a similar parameter combination. This is understandable because all models are fit on the same training set and have different dependent variables. Thus, this NN model also utilized 1 LSTM layer, 4 dense layers with relu activation, dropout with a value of 0.2, L2 regularization with a value of 0.00001, and Adam optimization with a learning rate of 0.01. As this is a regression model, it employed a mean squared error loss function. Figure 8 illustrates the training and validation loss of this model. Because the validation loss does not continue to decrease after ~20 epochs, it does not perform as well as expected. The final test MSE achieved was 0.77 and the final test MAE was 0.51.
Figure 8
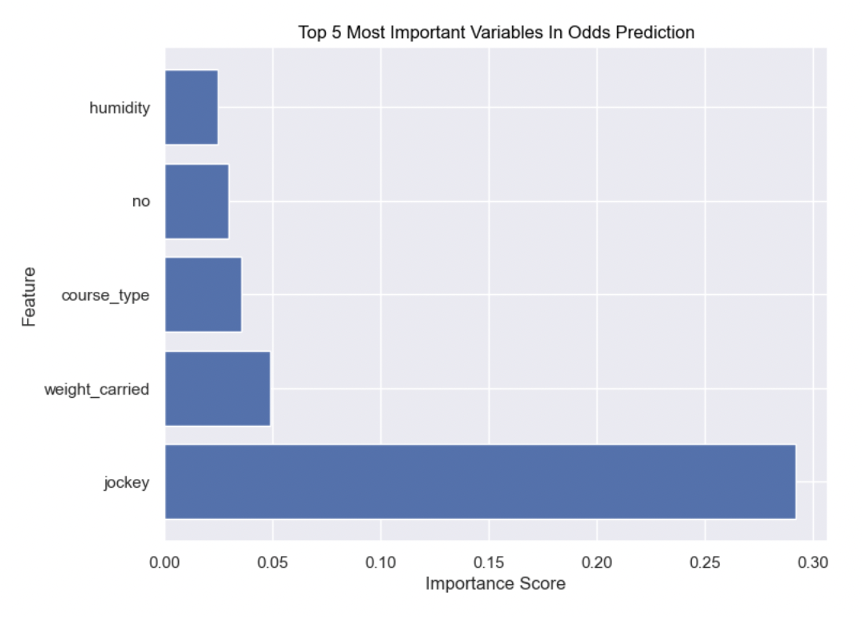
After comparing the ML model results to the NN results, it is apparent that odds cannot be predicted well with a ~0.77 MSE. The low R2 value attained from the ML models further ascertains this claim. NN models performed better than their machine learning counterparts, based on MSE values. From Figure 9 below, it is evident jockey was the most important factor in odds prediction. Part of the initial hypothesis was validated, as course type was the fifth most important variable in this prediction.
Figure 9
Business Question 3: Can we accurately predict the race purse and what factors are most influential in determining this?
Amongst the variables explored in exploratory analysis, there appeared to be minimal variance in the purse distribution. However, due to the minimal variance across track type values, we hypothesized that it might play a role in predicting purse. To address this business goal, three separate regression models were developed - Random Forest, XGBoost, and Gradient Boost. Grid search was leveraged on the ensemble methods to automatically tune hyperparameters. The performance of these models is depicted in Figure 10 below. Gradient Boost and XGBoost performed significantly better than Random Forest. Because Gradient Boost had the highest R2 value of 0.736 and the lowest MSE value of 0.281, it was selected as the most optimal ML model for purse prediction and was assessed against a NN counterpart.
Figure 10
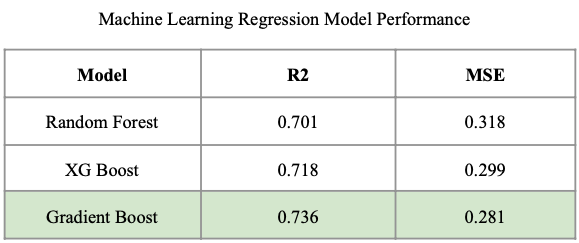
Figure 11
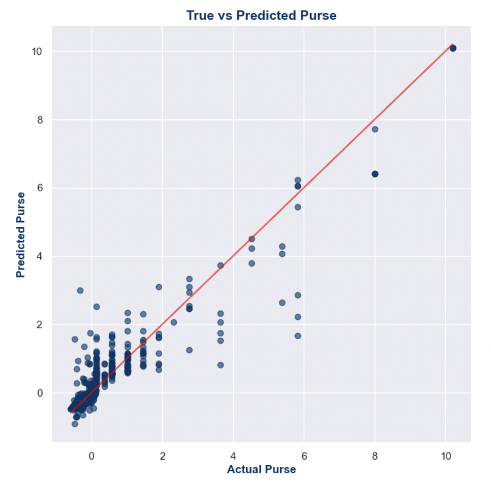
Similar to the previous use cases, the NN model predicting purse utilized 1 LSTM layer, 4 dense layers with relu activation, dropout with a value of 0.2, L2 regularization with a value of 0.00001, Adam optimization with a learning rate of 0.01, and employed a mean squared error loss function. Figure 12 below, illustrates the training and validation loss of this model. The model performs quite well, as the final test MSE was 0.26 and the final test MAE was 0.17.
Figure 12
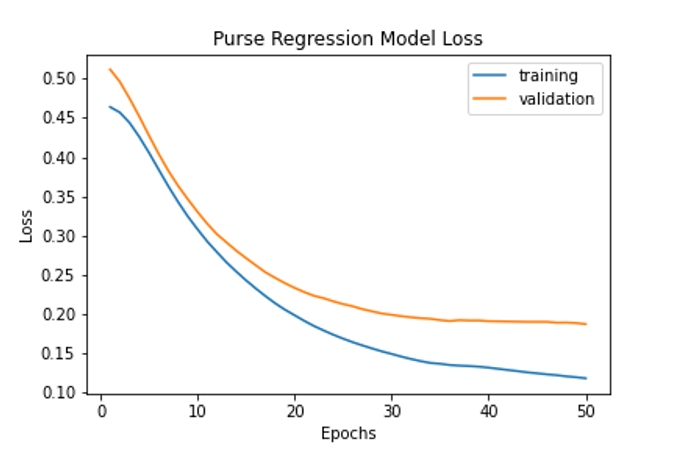
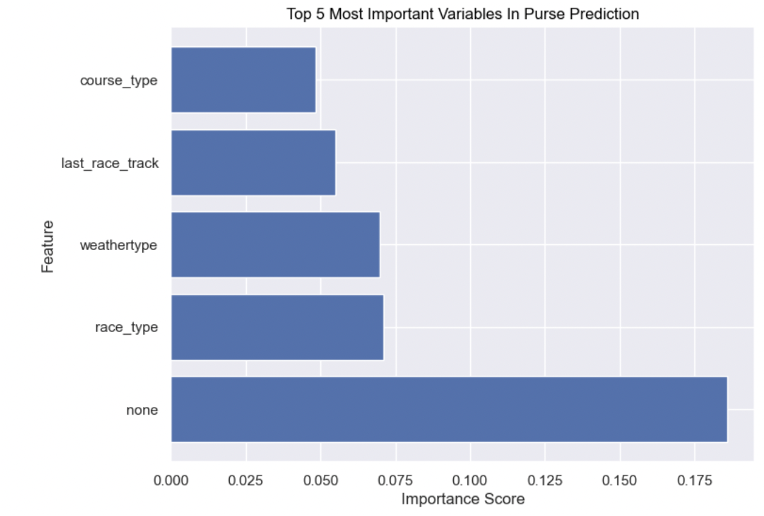
After comparing the ML model results to the NN results, it is apparent that purse can be predicted well, with a 0.26 MSE. NN models performed better than the machine learning model after tuning, as it had a lower error value. However, because the R2 value for machine learning was relatively high, these models may have performed more similarly than anticipated. From Figure 10 below, it is evident race type was the most important factor in purse prediction, followed by none. The latter is a value that was imputed for when comments were null; thus, this may be one of the most important variables due to the frequency of its appearance. Additionally, our initial hypothesis was incorrect, as track type was not an important variable in the purse prediction.
Figure 13
Conclusion & Next Steps
The key finding from this study is that for our specific business questions and dataset composition, neural networks performed comparably to traditional machine learning techniques for classification but were superior for regression tasks. Both types of modeling were able to predict purse and winner well, but performed poorly when predicting odds. Additionally, the jockey was critical in predicting winners and odds, as were the course type and the weight carried by a horse. This aligns with expectations as, intuitively, the likelihood of a horse winning a race and whether or not they will win is often based on historical performance or experience of the horse operator. Similarly, it makes sense that the weight carried by a horse is predictive of winning, as greater weight affects speed. Race type was critical in predicting purse; this aligns to expectations as the amount of money allocated to a given race would intuitively be influenced by the type of race it is. However, weather data was less predictive than expected, as was commentator text about horse performance.
In future work, we hope to expand our analysis to a larger geographic and temporal sample. The generalizability of these findings is limited, as all races in the dataset were in New York in 2019. Additionally, bringing in horse image data would likely increase predictive accuracy and allow neural networks to demonstrate their full capability to perform image classification. Although this aspect of our research focused solely on competition strategy, we hope to perform subsequent analyses via image detection to address horse health.
Works Cited
1. Corporation, Visual Crossing. “Easy Global Weather Apisingle History & Forecast Weather API.” Free Weather API | Visual Crossing, https://www.visualcrossing.com/weather-api.
2. Addison Howard, Joe Appelbaum,. (2022). Big Data Derby 2022. Kaggle. https://www.kaggle.com/competitions/big-data-derby-2022/overview
3. History statistics. EQUIBASE. https://www.equibase.com/premium/eqbRaceChartCalendar.cfm?SAP=TN